
Please see below a demonstration that provides custom table calculations for a rolling 12 month average. In our case, we have not been live with Mark43 for more than two years. As such, the rolling average needs to be truncated to only calculate for months at least 12 months since go-live to ensure we are not taking an average of fewer than 12 months of data.
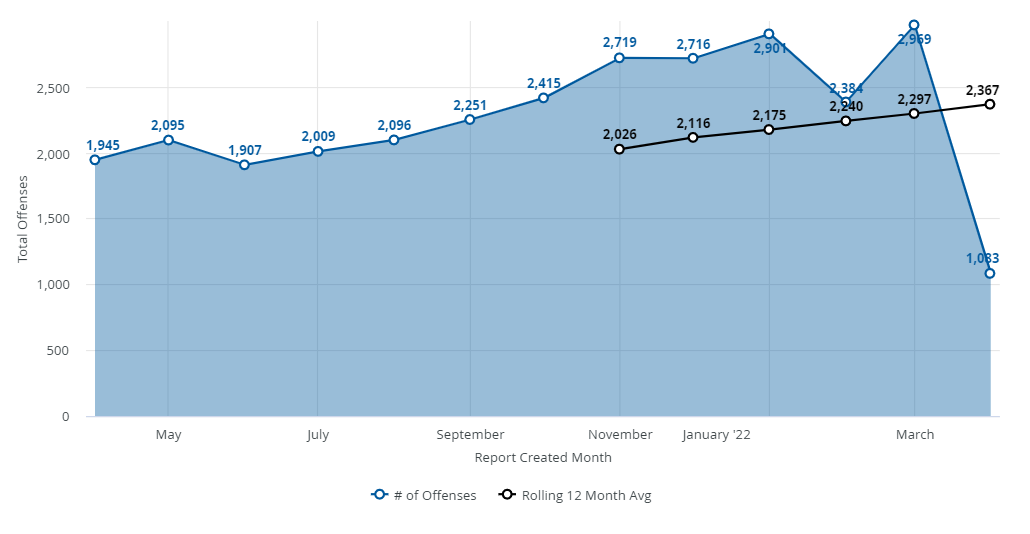
Here is an example of a chart (Visual 1) that displays offense frequency by month and a rolling average for the 12 preceding months. The rolling average is truncated to stop calculating before November 2021 because we went live with Mark43 in November 2020. Therefore, preceding averages would not provide an average of a full 12-month period and may misrepresent the true average.
Visual 1:
Here is a chart of the dimensions and measures used to create this visual (Visual 2). One dimension, one measure, and one table calculation is required. The dimension used here is “Report Created Month, ” though it can be easily changed to any other date dimension (i.e., event start week, updated year, etc.). The measure is # of offense/incidents (provided in the Reports Data Explorer - Offense/Incident). These two components are simple, but the table calculation achieving the truncated rolling 12 month average is what we will focus on.
Visual 2:
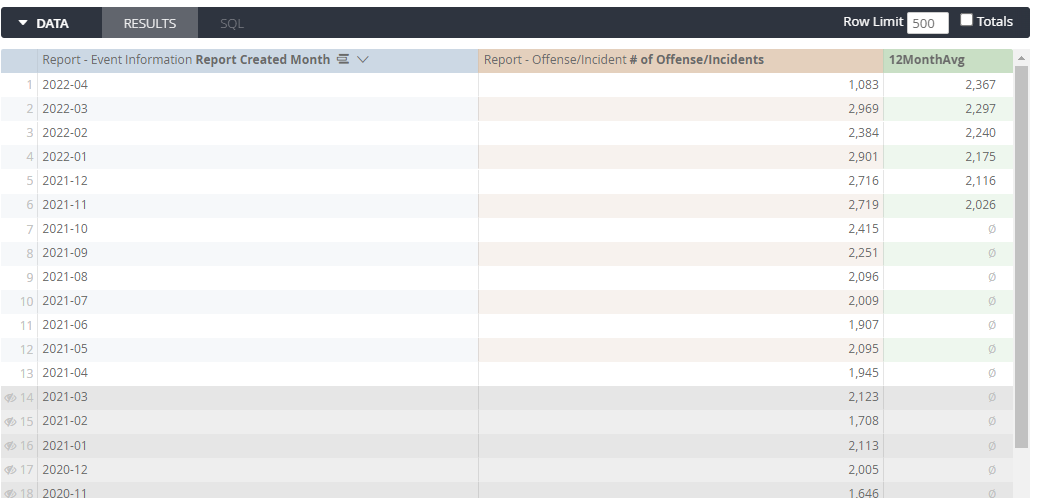
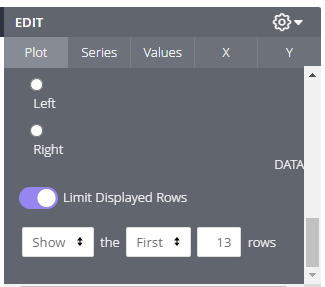
You will also notice that rows 14 and beyond are hidden (as indicated by the darkened row color and the eye by the row number). This is just a preference for this visual to only display the most recent 13 months of data. This can be achieved by sorting the data in descending order based upon the month field and using the “Limit Displayed Rows” option within the plot panel of the visual edit pane (see Visual 3).
Visual 3:
Now for the custom table calculation:
if(
diff_months(
date(2020,11,01),${vw_report_event_infos.report_created_month}
)
>11
,
mean(
offset_list(${vw_report_offenses.count_of_offenses},1,12)
)
,
null
)
This table calculation uses an if statement to determine whether the report created month of an offense incident report is more than 11 months after our go-live date (11/01/2020). The first part of the if statement provides this assessment using the diff_months function. This function requires two parameters and supplies the total number of months between two dates. The first parameter is the start date (this is hard coded here with the Go-Live date using the date(2020,11,01) function). The second parameter is the report created month. For report created months where this is true (i.e., any month after October 2021), then a mathematical mean calculation is performed. when it is not true, then a null value is assigned.
The second piece of this if statement is performing the average (mean) when the report created month condition (being at least 12 months after the go-live month) is met. In order to calculate the average, the mean function is used. However, I must first provide the mean function the subset of data I wish to calculate the mean for. This is accomplished using the offset_list function.
The offset_list function builds a list of values based upon 3 parameters supplied to the function. Our goal is to provide the frequency of offense/incidents for each of the preceding 12 months. The first parameter requires the identification of the measure for which the list is to be complied. In this instance we are looking at the ${vw_report_offenses.count_of_offenses} measure we have already included in our table. The second parameter is the number of data rows for which you want to offset the calculation. Since we don’t want to include the current month in the mean calculation, we need to provide an offset of 1. This will ensure that the current month is not included in the average. The final parameter is the number of data rows that you’d like to include in the offset list. Since we are calculating a 12-month average, this value is 12.
As previously stated, this calculation is only performed for offense/incidents that have a report created month at least 12 months following the go-live date of 11/01/2020. However, if our dimension was weeks, the table calculation would provide the rolling 12-week average (with an update to the appropriately referenced dimension in the table calculation).
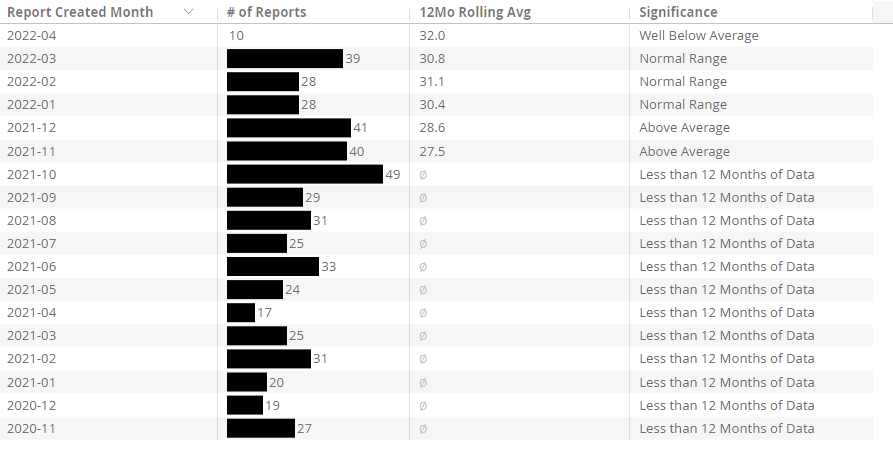
This process can be applied beyond descriptive statistics to perform inferential tests of statistical significance (i.e., T-tests, Z-tests, etc.). Then custom calculations can be used to provide simple indicators such as whether the frequency is statistically significant, in what direction, and indication of the magnitude (an example of a t-test significant result is in the Significance column of Visual 4).
Visual 4:
There are a few other tricks here to the visual format, but this is the gist of the rolling period average table calculation that invokes a truncation.
Hope this gives you a few ideas to manipulate data within the Analytics module.
I hope others share some of their experiences too!